Handout and Brochure Design
Infographics design applies directly to designing one-page handouts or brochure to communicate a simple, clear message including product guides, sales brochures, presentation handouts, event schedules, and leave-behind flyers. Sized specifically to fit within report pages both printed and on-screen, integrating custom-designed visualizations into your reports will demonstrate your expertise and credibility within your industry. In addition to designing many data visualizations and visual explanations to be included in reports, for many of these we also design the complete layout, style and marketing collateral.
Let’s talk about making your reports amazing!
Many of the reports we design are confidential, internal reports, but here are some of the publicly available reports we helped bring to life:
The DALLAS Project Series,
SMU Deason Criminal Justice Reform Center
The District Attorney Learning and Leadership through Application of Science (DALLAS) initiative is a research partnership between the Deason Center and the Dallas County District Attorney’s Office. This powerful collaboration considers how prosecutorial reforms impact racial equity and due process, and empowers the District Attorney to make data-informed decisions.
InfoNewt used visual explanations to help make sense of the legal processes, and data visualizations to show the research results from across Dallas County. We also designed the complete style and layout of these reports.
Sample Pages:


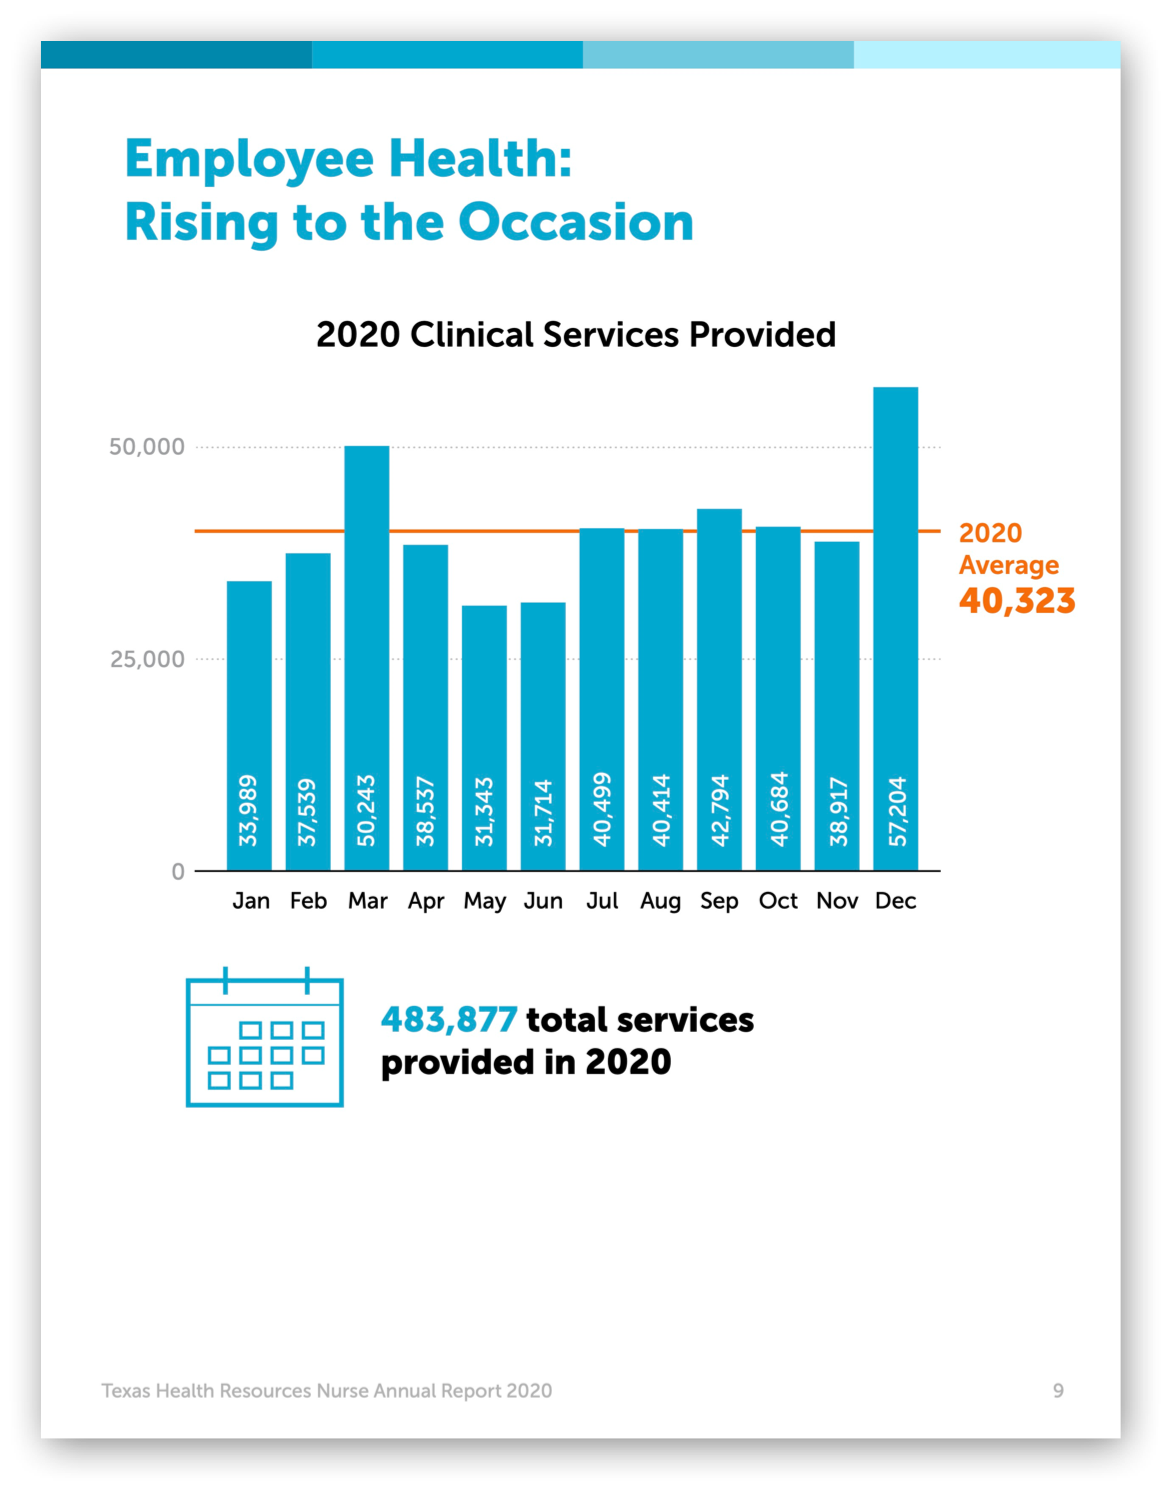
Nursing Annual Reports, Texas Health Resources
Each year we help Texas Health celebrate the amazing work and compassion of their over 7,800 nurses.
A bold report layout and data visualizations help communicate the achievements an accomplishments of these nurses to all of the employees and stakeholders.
Completed Reports:
Sample Pages:


Big Data, Small Credit, Omidyar Network
This research report sheds light on a new cadre of technology companies who are disrupting the credit scoring business in emerging markets.
A combination of visual explanations and data visualizations help bring to life the in-depth survey data from Kenya and Colombia early adopters.
Completed Report:
Sample Pages:


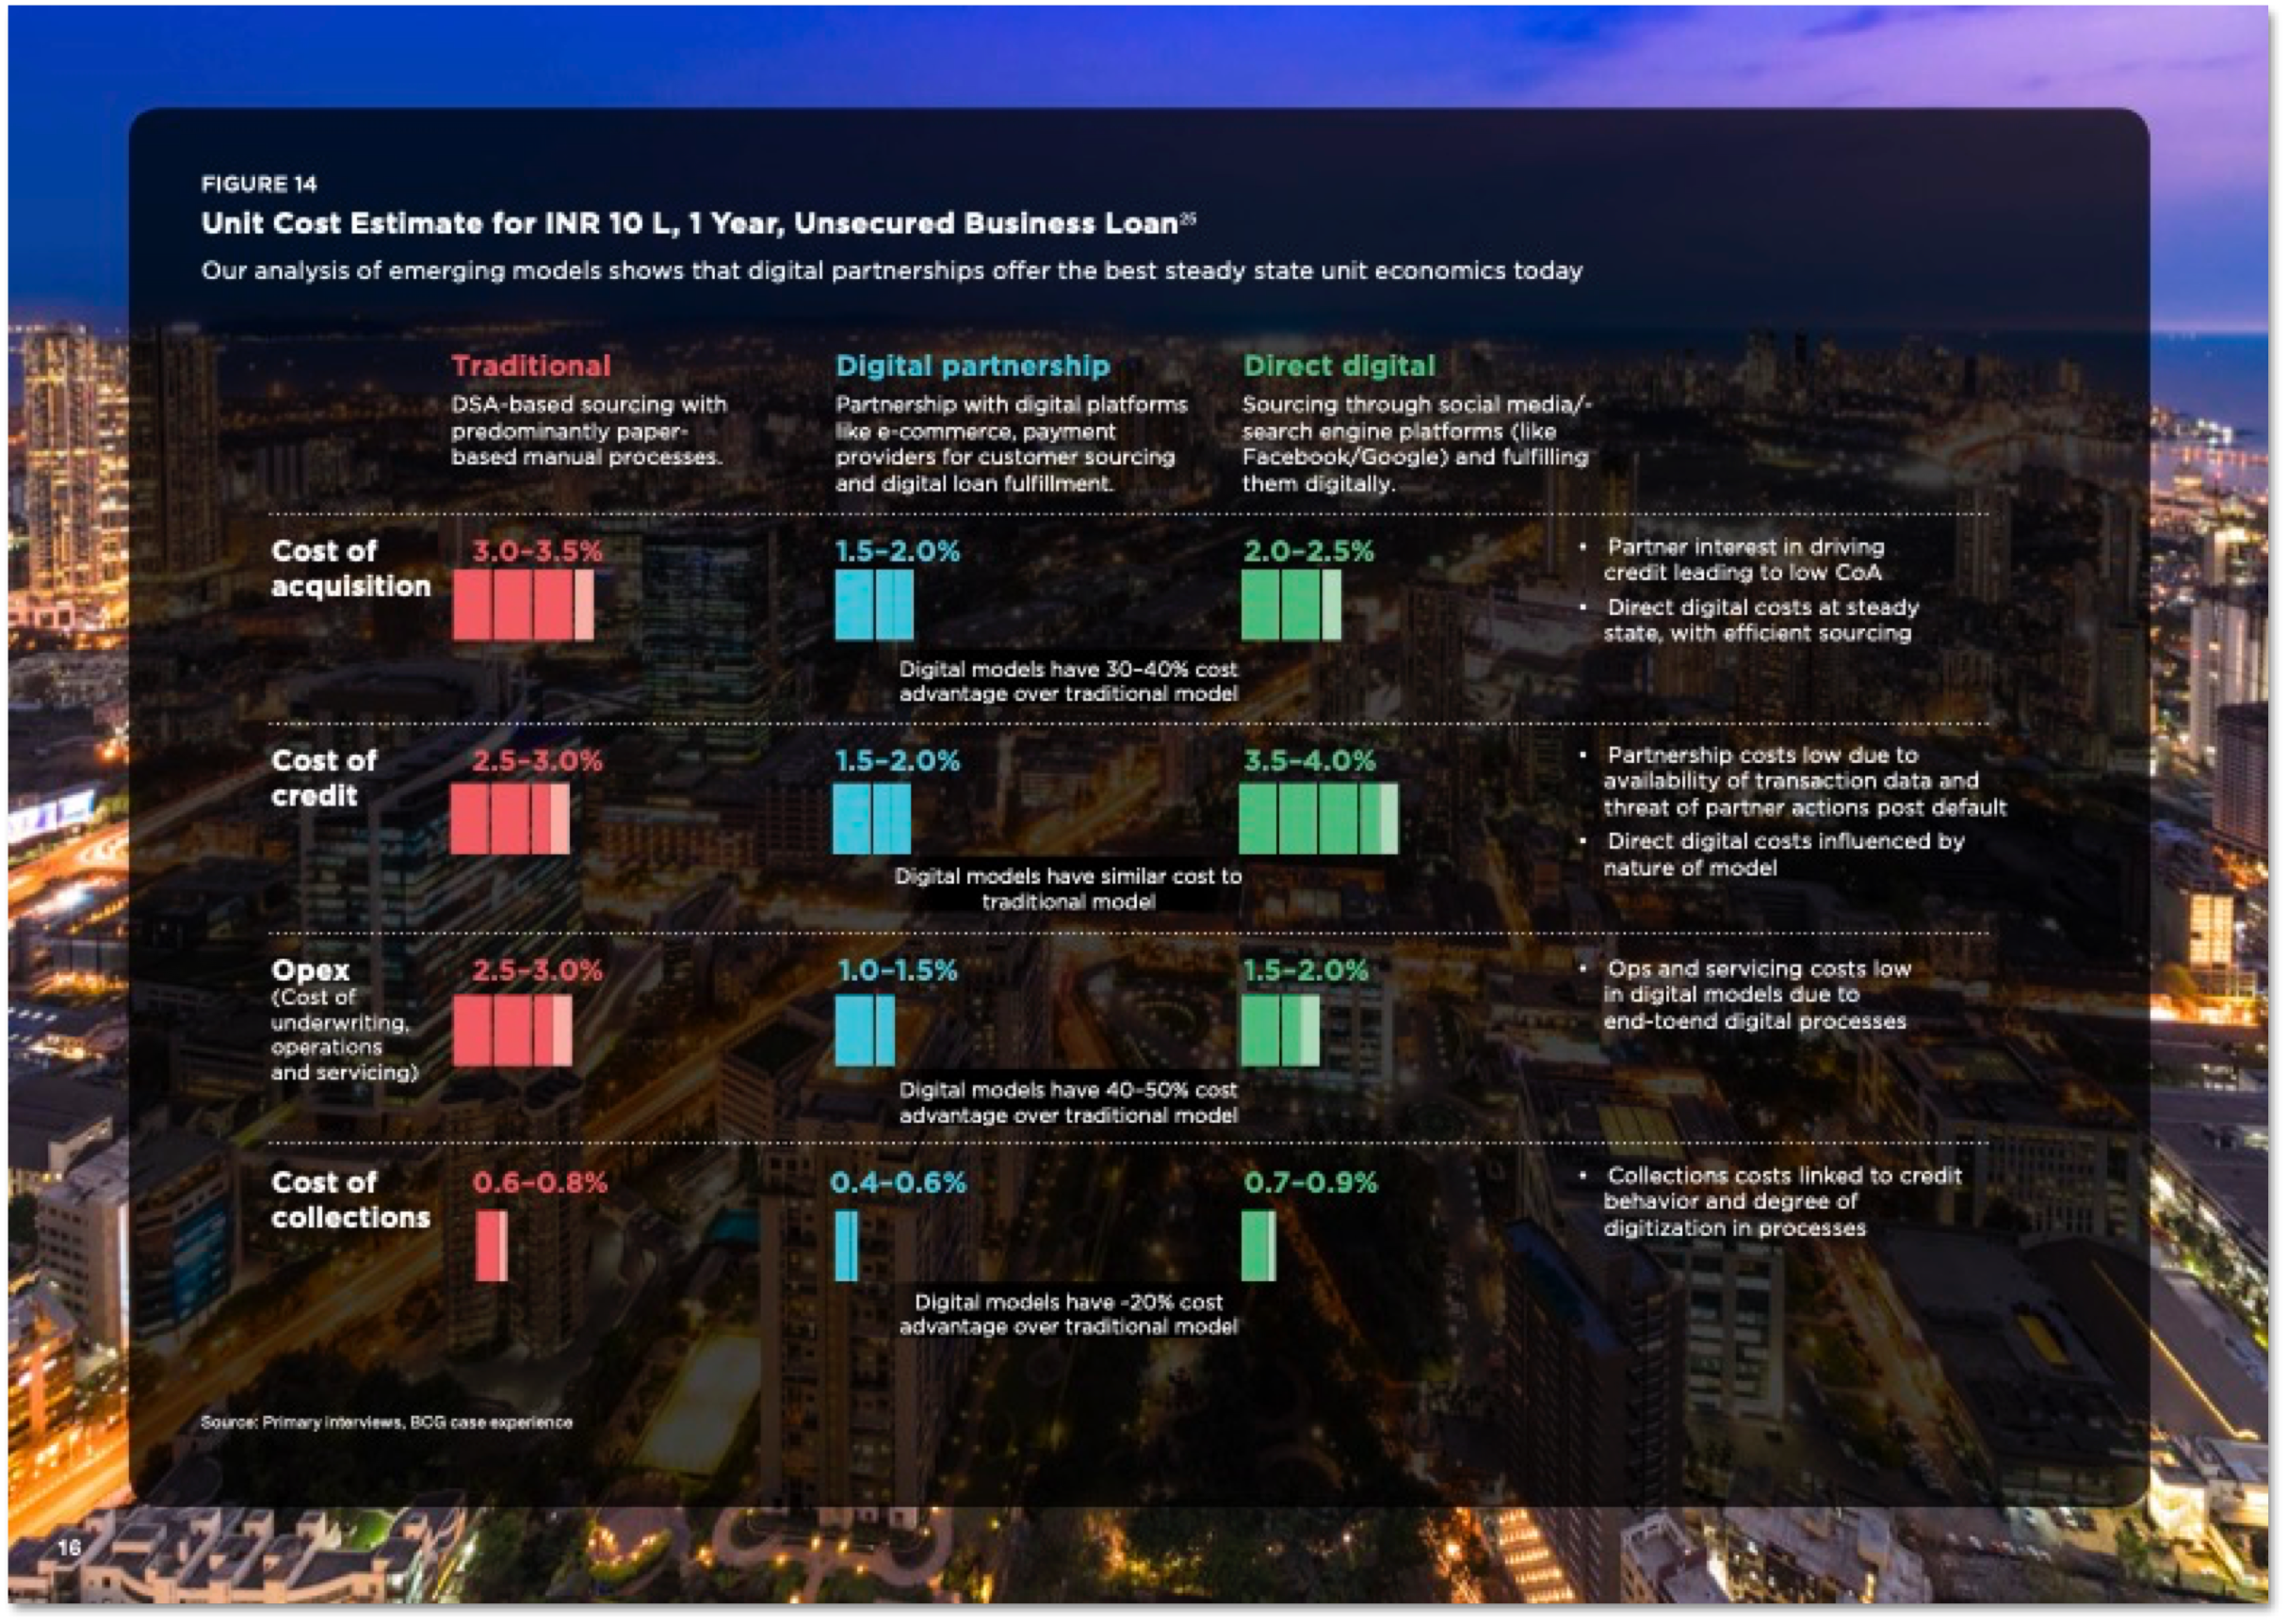
Credit Disrupted, Omidyar Network India
According to the this report, released by Omidyar Network and Boston Consulting Group, nearly 40 percent of India’s 60 million micro, small and medium enterprises (MSMEs) are forced to borrow from informal sources that charge an average of 2.5 times higher interest rates than those in the formal sector.
InfoNewt collaborated with the Omidyar Network to design all of the data visualizations and visual explanations contained in the report.