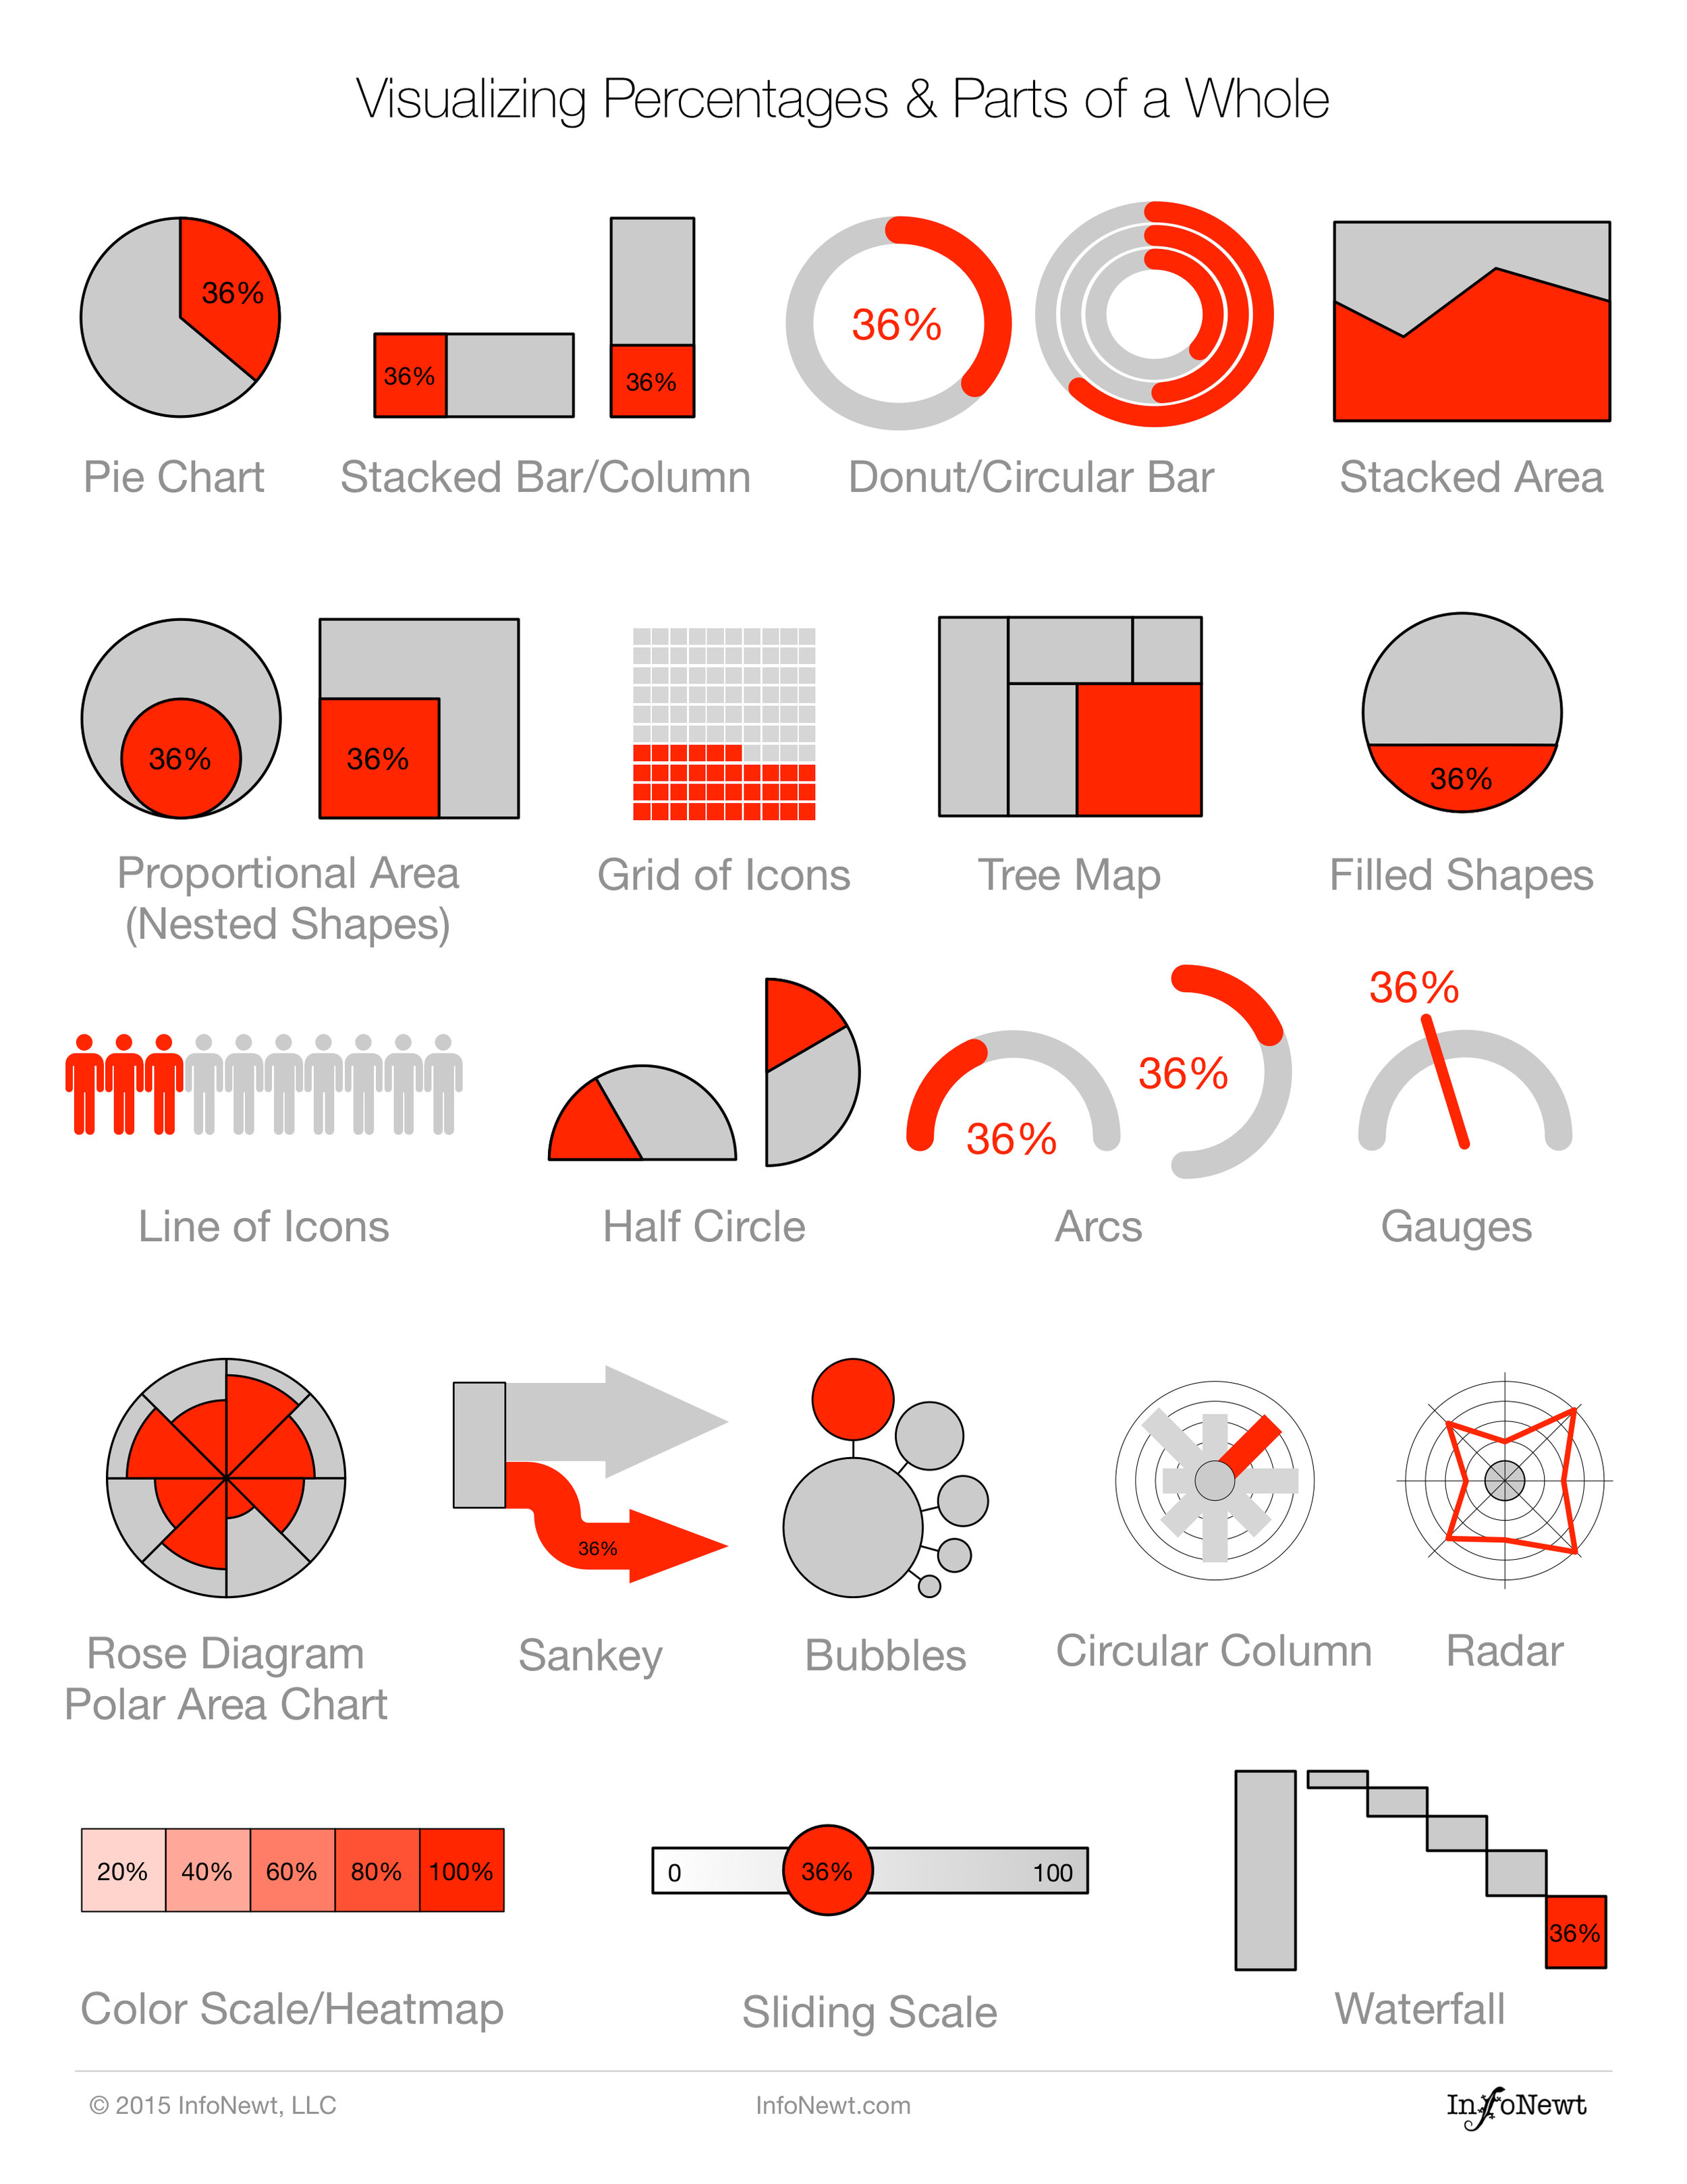
Visualizing Percentages
Working with percentages is very common, and one of the most challenging parts of designing data visualizations is coming up with new ways to visualize your data. I created this reference sheet for my classes and workshops to give them some ideas for different ways to visualize percentage data, and help them break out of using pie charts all the time.
You can download a PDF of the reference sheet here: Visualizing-Percentages-20-Ways-InfoNewt.pdf